
Much like the epic surge that sped forward and burst forth from the banks of the Cedar River on that fateful early June of 2008; the semester for classes has sped by and finals are atop us.
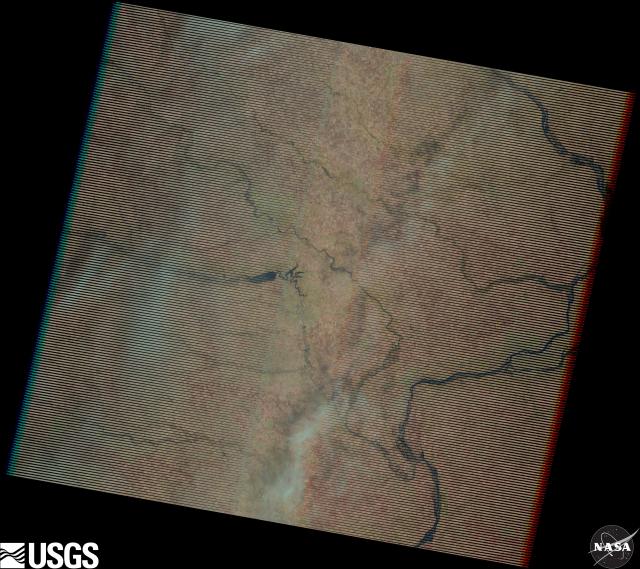
With the clouds now removed from the picture, via the masking discussed in the second post about the final project, the computer can get down to working and showing us visually where the changes occurred between two different satellite images taken by Landsat 5. For our study, I used images captured in June 2007 and June 2008. By comparing the two images in change detection, we can see, literally from space, where the biggest changes (meaning flood water) occurred at.


Presented here in false color imagery, so that vegetation can be easily identified versus that of the rivers and cityscape of Cedar Rapids, is the 2007 and 2008 images. Both have the same cloud mask applied to provide continuity for the change detection.

Seen above via ENVI 5.3 processing, is a change detection difference map. This helps show in a red/green color scale changes the system can detect via powerful algorithms the changes and the value of changes in pixels captured at two different periods in time by Landsat 5. We’re most interested in the blue pixels of the deeper shade, as they represent the largest most profound changes along the banks of the Cedar and Iowa rivers.

Shown above is an alternate processed image that is created via image change workflow toolset in ENVI. This image I find visually provides a more stunning example of the amount of flooding that took place that fateful June. The darkest sections show the most profound changes in the panchromatic imagery. If one looks closely at the city of Cedar Rapids, you can spot the massive damaging floods that took out block after block of homes and businesses in the city. Truly it was an epic surge.